926
Views & Citations10
Likes & Shares
An attempt was made to construct an adequate model of interrelation of radioprotective properties of biologically active chemical compounds with their electronic and information factors. Biological activity (radiation protective effects) of chemical compounds has been analyzed in relation to their electronic sign and the information function. Statistical comparison of qualitative indices has revealed that electronic and information signs the most informative characteristics of the molecules responsible for radiation protective action. Correlation equations are given for electronic and information dependent change in the antiradiation properties of the molecule. Quantitative estimates were made associating the protective efficiency of the chemical compounds under study with variations in the electronic parameters and dose of chemicals.
Keywords: Bioactivity, Statistics, Molecular Structure, Electronic Sign, Information Function, Radioprotector, Statistical Criterion, Contingency, Correlation.
Abbreviation: I.P: Intraperitonel, A.R.P: Antiradiation Protection, RE: Radioprotective Efficiency, RMSE: Root Mean Square Error.
INTRODUCTION
Knowledge of quantitative stochastic interrelation between the chemical structure of a molecules and its biological activity has important theoretical and practical significance. It is necessary both to clarify the mechanism of biochemical action of molecules, and to search for promising new drugs. It is known that the classical apparatus of probability theory and mathematical statistics is the basis of the stochastic simulation of natural phenomena. The main party of such research is to estimation of the closeness of causal relationships between explanatory parameters and response of the biological system.
Causal relationship implies that their recurrence lead to the same consequences. However, a causal relationship can be subject to fluctuations due to random deviations. These fluctuations are due to the uncontrolled and unaccounted factors and are identified by statistical laws.
One of the most relevant issues of modern chemistry of biologically active substances is the problem of creating new effective radioprotectors. The main demands on these drugs are low effective dose, low toxicity and lack of side effects. The existence of side effects significantly limits the practical applicability of radioprotectors. Statistical methods are the most rational in solving problems that are associated with the study of action of a combination of factors on the biosystem. Since the effect of the interaction of drugs with biosystem depends on many conditions, then it has a probabilistic nature. Therefore it is preferable to use a probabilistic model.
It is not always possible to construct an adequate model which describes the relationship of the chemical structure of the compound with its biological activity. If the model is overloaded with a large number of non-essential characteristics use such model becomes almost impossible.
At the same time, nothing can compensate for the shortcomings of the model, if the main link has been lost. Therefore, an adequate model should be as close as possible to simulate the basic properties of chemical compounds. Figuring out of the connection between molecular structure and biological activity will allow carrying out a targeted search for new chemicals, and also can contribute to deciphering the mechanisms of their bioactivity.
METHOD AND DISCUSSION
For a description of the interrelation of bioactivity with molecular structure, we use the descriptors (attributes), the calculation of which requires knowledge of only the structural formula of chemical compounds. We take into account the remark of Alexander P and Bacq Z [1] on the importance of the primary chemical structure of the drug in the mechanism of protection against ionizing radiation.
We use the average number of electrons in the outer shell of atoms as a sign of the molecule [2]:
where
where
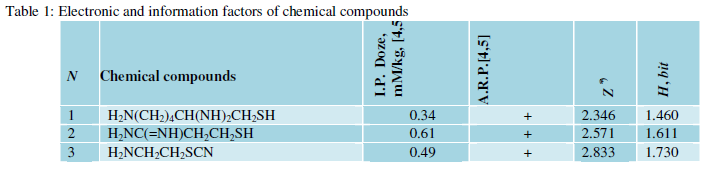
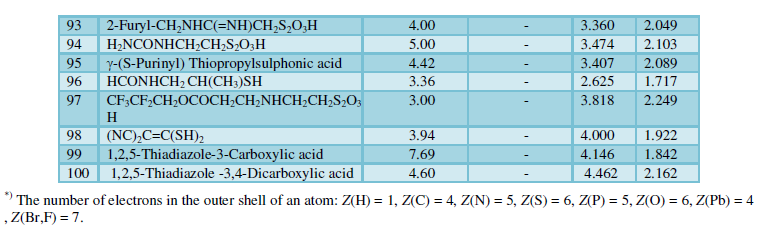
Two groups of chemical compounds are given in Table 1 [4,5]. The first group contains chemical compounds with an effective radioprotective effect (dose ≤ 1mM / kg; the survival of more than 50%, chemical compounds are marked with "+" sign). The second group contains chemical compounds, which have no anti-radiation activity at high doses: Dose> 2mM / kg (these chemicals are marked with "-" sign). This choice of the chemical compounds imposes restriction on the size of the sample.
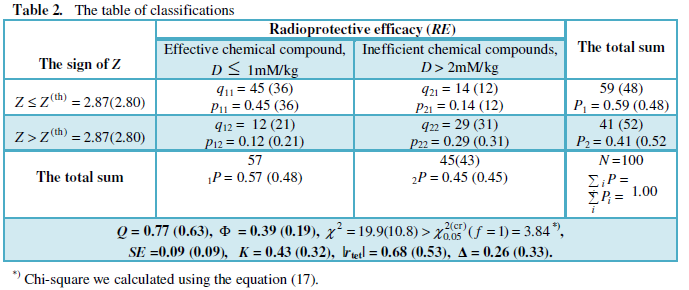
Our goal is to find a classification rule that statistically reliable divides the active and non-active chemical compounds. To do this, we use the association method (statistical methods for rates and proportions) for signs which have an alternative variation ("yes" or "no"). Observations and sign (Z) of molecules can be represented as 2 × 2 table or tetrachoric table (Table 2). We will carry out the analysis of the interrelation of chemical compounds bioactivity and the magnitude of sign of Z.
First of all, we need to set the threshold value of the sign Z(th) which statistically significant separates effective radioprotectors from ineffective radioprotectors. We first determine the mean value of the sign of Z for the sample chemical compounds (Table 1). We obtained the following statistics for average value Z:
N = 100,
Here
where f is the number of degrees of freedom.
From the inequality (5) it follows that the chemical compound number N = 100 (
N = 95,
(6)
Here
(7)
Thus, the sample is uniform and fits the normal distribution. Here p value determines the significance level of criterion which determines the probability of error (~ 10%); f is the number of degrees of freedom. Criterion of Wilk-Shapiro is also satisfied: W = 0.989 >
Now we can determine the average value of Z for the effective and ineffective radioprotectors (N = 95). As a result, we obtained the following statistics:
N1 = 57,
N2 = 38,
Values of Z are located around
The inequality (9) shows that at the 5% significant level the null hypothesis of equality of average values can be rejected. Consequently, the difference between the average values
In the first approximation, we can assume that the average value
According to the analysis, it is preferable to choose a threshold is equal to
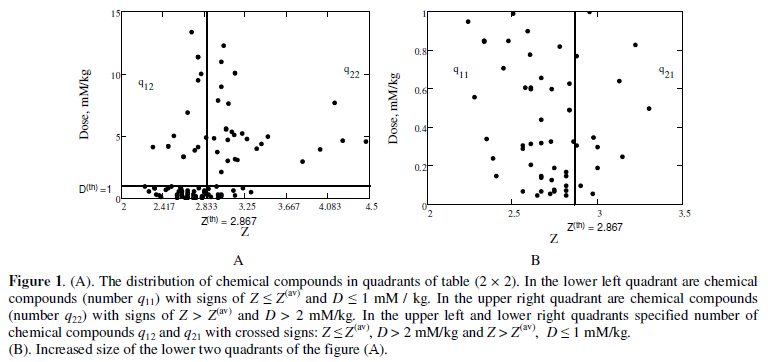
We need to verify to see whether the separation of chemical compounds into two conditional groups is the result of random factors. Description of classifications, it is convenient to start with the construction of the table of mutual contingency (or association) [8,9] (cross-selection method). Figure 1 shows the distribution of the chemical compounds by quadrants of the rectangular 2 × 2 table (table of "four fields"). In each cell of the table is indicated the number (frequency) of qij objects. Obviously, the classification model better describes the phenomenon, the closer the contingency table to diagonal form. In which connection for the objects in each quadrant, we do not assume the existence of a functional mathematical relationship between the dependent variable and the explanatory variable.
Contingency (association) method is applicable, if the sample size satisfies the following inequality:
We use the following equation to determine the Pearson contingency coefficient Φ [9] between the radioprotective efficacy and value of the sign of Z :
Here number of degrees of freedom is equal to f = N – 2;
The coefficient Q = 0.77 point to the existence of the interrelation between the signs. Obviously, this coefficient is in the following range of values:
Signs RE (the radioprotective efficiency) and Z are independent if the product of the marginal or unconditional proportions is equal to the joint proportion (see Table 2). For example, we obtained the following result:
The application of the threshold value
Let's see the representativeness of the sample (Table 1). Using a table of random numbers [6], we will make a partial sample of data Table 1. The method of random numbers avoids involuntary and systematic mistakes in the preparation of the sample. As a result, we obtained the following sequence of random numbers:
03, 47, 43, 73, 86, 36, 96, 46, 63, 71, 62, 33, 26, 16, 80, 45, 60, 11, 14, 10, 74, 24, 67, 42, 81, 57, 20, 53, 32, 37, 27, 07, 51, 79, 89, 76, 66, 56, 50, 90. (12)
A series of random numbers, we can obtain, starting from any point of the table of random numbers. We wrote all the random numbers that do not exceed number of 96 [6]. Comparing these numbers with random numbers of chemical compounds Table 1, the partial sample of 40 items was obtained. In a partial sample the sequence of chemical compounds represented by "with an open mind" [10]. Statistics of the partial sample is as follows:
N = 40,
N1 = 24,
N2 = 16,
This result is similar to the statistics (6), at while the sign of Z is represented in the same proportion as in the original sample.
The standard error of contingency coefficient we can be assessed using the following equation:
(14)
Testing of the significance is carried out by using chi - test [9]:
i.e., at the α = 0.05 significance level of the null hypothesis can be rejected. For normally distributed data, you can additionally use the tetrachoric coefficient (-1 ≤ rtet ≤ 1) association:
However, if the distribution of frequencies on borders of two-by-two table is non-uniformly, then coefficient becomes unreliable. Therefore, commonly used [8,9], Pearson goodness of fit (adjusted for continuity of Yates):
Here N = q11 + q12 + q22 + q21 is the sum of all frequencies. The inequality (17) shows that there is a statistically significant interrelation of signs. However, the criterion (17) does not give an idea of the strength of the signs interrelation. The assessment of closeness of the linkage between the signs can be obtained by using the coefficient of mutual contingency Pearson:
The indicator of mean-square of mutual conjugation
Using equation (18) we determine the coefficient of mutual contingency K = 0.43 (0.32), which confirms the interrelation of dichotomous signs.
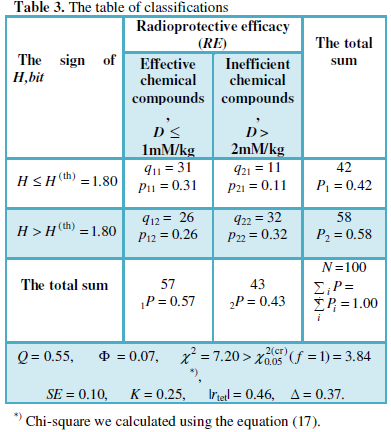
Study of the interrelationship of the molecules structure - activity showed that the electronic sign of Z is associated with the Shannon informational function [11]:
where
Using the data of Table 1 we define the average value of the information function:
N = 100,
We verify the compatibility of the units of the sample on the basis of H:
Consequently, the sample does not contain incompatible units. Statistics of average values of information functions for effective radioprotectors will be as follows:
N1 = 57,
This subset is close to a normal distribution:
These inequalities are point to the lack of incompatible units.
For the inefficient radioprotectors statistics of the average value will be as follows:
N2 = 43,
Checking of units of the second subset leads to inequalities:
From the second inequality (29) it follows that the chemical compound number 16 (H = 1.174 bit) is incompatible with the other units of the subset. After excluding this element, we obtained the following statistics for the information function:
N2 = 42,
This subset is close to a normal distribution:
Thus, the subset comprises only compatible units.
Let's see whether the distinction between the average values of
(30)
N = 99, N1 =57, N2 = 42, SH1 = 0.21, SH2 = 0.17 .
The inequality (30) rejects the null hypothesis on equality of the average values of the information functions.
Again, we will use the association method of qualitative signs. We choose as the boundary value the following value of the information function (23):
Thus, the sign of H serves as the boundary between effective radioprotectors and ineffective chemicals. Variation of the threshold
Let's examine these classification rules for chemical compounds that have anti-radiation activity. These chemical compounds were not included in the original sample: 1) NH2CH2CH2CH2SH (Dose: 3.79mM/kg; Z = 2.73, H = 1.43bit), 2) (CH3)2S=O (Dose: 6.4-12.8mM/kg; Z = 2.60, H = 1.57bit), 3) NH2CH2CH2NHCOCH2SH (Dose: ~ 2mM/kg; Z = 2.63, H = 1.77bit), 4) cysteine (Dose: 1.56-1.94mM/kg; Z = 2.36, H = 1.49bit), 5) disulfide β – mercaptoethylamine (Dose: 0.99-1.18mM/kg; Z = 2.50, H = 1.57bit), 6) S – β aminoethylisothiuronium (AET) (Dose: 1.68-2.10mM/kg; Z = 2.63, H = 1.63bit), 7) (CH3)2N-C6H5-CH(OH)-S-CH2CH2NH2 (Dose: 0.88-1.77mM/kg; Z = 2.55, H = 1.56bit). Obviously, signs of these chemical compounds satisfy the inequalities:
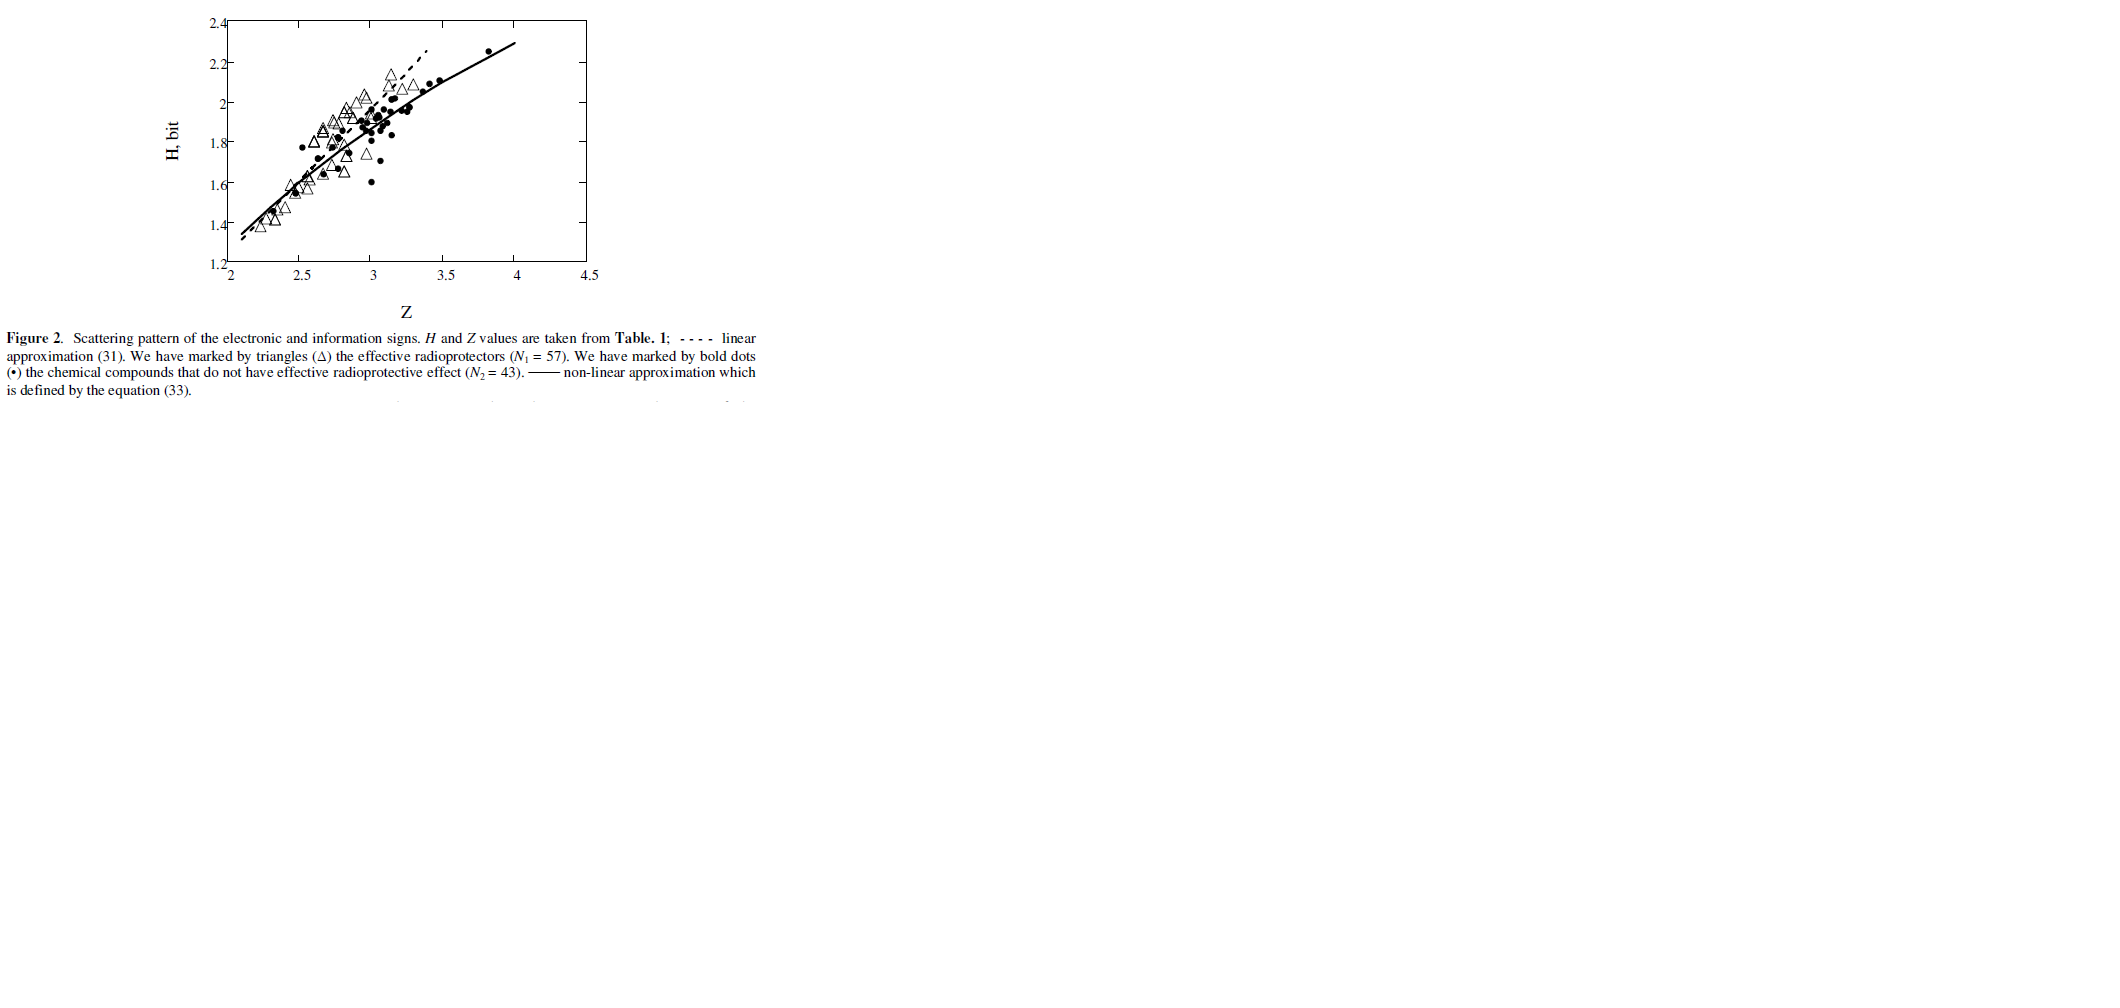
The analysis has shown the molecular signs of Z and H are interconnected. For the effective radioprotectors the interrelation can be described by the following linear regression (Fig. 2):
The absolute term A and the regression coefficient B are equal to:
A = – 0.332 ± 0.338, SA = 0.169, B = 0.772 ± 0.124, SB = 0.062,
RMSE = 0.109,
F =153.3 >>
Here statistics
For chemical agents which do not possess effective radiation protective action, this interrelation is nonlinear (Fig. 2) and can be approximated by the following analytical form:
N2 = 43, RMSE = 0.074,
We can get additional information about the nonlinear dependence of H(Z) (Fig. 2) from a variational series of the grouped chemicals. It's typically used 6-8 groups for the sample size N ≈ 40-60. You must first make a ranging of the variational series (for example, in ascending of Z). It is convenient to make groups at regular intervals. We chose the number of groups equal to n = 6. Using the approximate relation
(34)
The subscripts indicate the number of groups. Parameter
Separation of sample units into groups allows you to calculate the empirical correlation ratio
Then we can calculate the theoretical correlation ratio
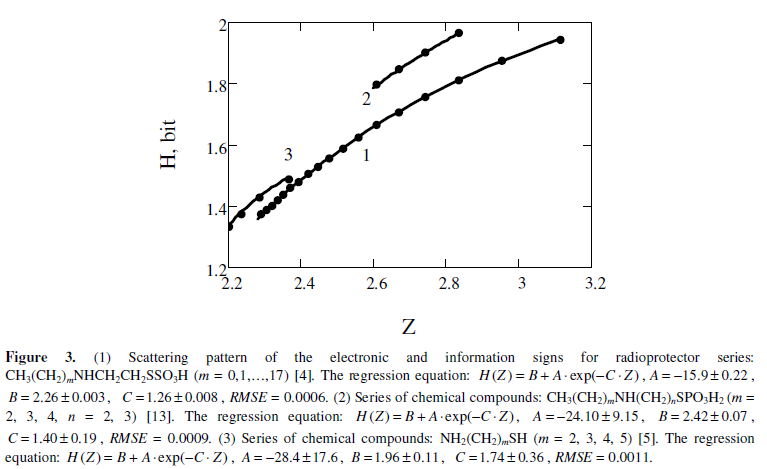
Figure 3 shows the interrelationship of the information function and the electronic factor when changing the number of atomic groups CH2 in molecules. RMSE values are so small, that the interrelation between factors Z and H come close to a functional interrelation.
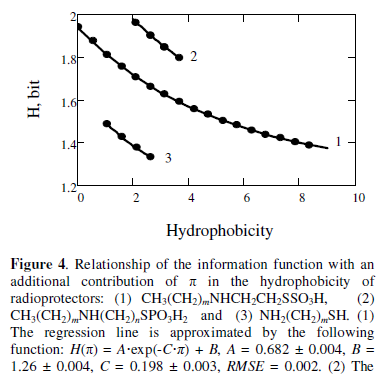
As analysis has shown the information function relates to the value of π. The value of π = 0.52 [14] defines an additional contribution of the group atoms CH2 in hydrophobicity of molecules. Figure 4 shows this relationship for radioprotectors: CH3(CH2)mNHCH2CH2SSO3H (m = 0, 1, …, 17),
CH3(CH2)mNH(CH2)nSPO3H2 (m = 2, 3, 4; n = 2, 3), NH2(CH2)mSH (m = 2, 3, 4, 5).
The positive interrelation between the signs of Z and H is not random. Information function determines the diversity of the molecular structure, which in turn is determined by the number of different atoms, forming a bound complex of atoms, i.e., molecules. At the same time, the structure of the molecule is not an arbitrary set of various atoms, but is determined by the valence electrons in the outer electron shell. Apparently, this quantum-chemical property establishes the interrelation of two signs of Z and H for molecular structures.
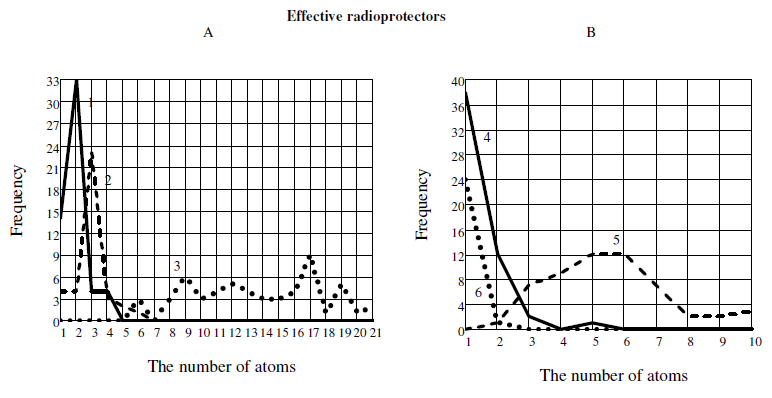
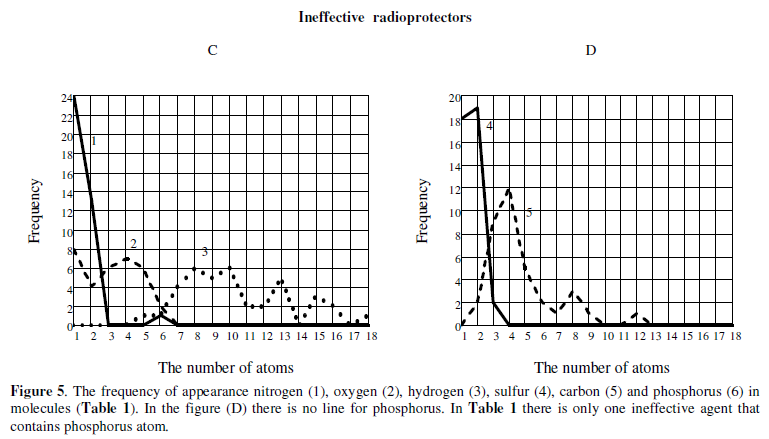
Some distinctions between effective and inefficient radioprotectors we can get if we will analyze the frequency of the atoms appearnce in the molecule. Figure 5 shows the frequency of occurrence of atoms (C, H, N, O, S, P) in the molecule.
Using the data of Table 1, we can approximately indicate the frequency of occurrence of atoms in a molecule of hypothetical effective agent (for a homogeneous sample): P ~ 1, S ~ 1, N ~ 2, O ~ 3, C ~ 5-6, H ~ 17 (Fig.5)[1]. At the same time the most probable distribution of atoms in the inefficient agents (hypothetical molecule) will be as follows: P ~ 1, N ~ 1, O ~ 1, S ~ 2, C ~ 4, H ~ 8-10.
CONCLUSION
The proposed classification rules allow to identify the similarities between the molecular structures. These rules can be practically useful in a preliminary forecast of bioactivity of new chemical compounds. It should be noted that for the calculation of signs of Z and H is only required the knowledge of the chemical structural formula. This makes much easier the work in a preliminary searching for new bioactive chemicals. Classification rules allow you to set whether you can expect from a chemical compound effective biological action. The ability to separate the biologically active chemical compounds from the inactive chemical compounds on the basis of the sign of Z, apparently is due to the existence of the real molecular electrostatic potential. The magnitude of this potential varies from molecule to molecule. Moreover, there is a threshold of the electrostatic potential for effective chemical compounds which is lower of some value (in absolute value). The method described in this article, has yielded positive results when researching antifungal activity and toxicity of chemical compounds [15]. This method was also used in the analysis of the activity of carcinogenic chemicals [16].
However, it should be noted that these rules are not sensitive to iso-electronic molecular systems, as well as for the isomer molecules. This approach gives the most reliable results when analyzing the homologous series of chemical compounds. Homologous series are generally characterized by the signs that satisfy the compatibility condition.
- Alexander P, Bacq ZM, Cousens SF, Fox M, Herve A, Lazar J, et al. (1955) Mode of action of some substances which protect against the lethal effects of x-rays. Radiat Res 2: 392.
- Veljkovič V, Lalovič D (1977) Simple theoretical criterion of chemical carcinogenicity. Experientia 33: 1228.
- Veljkovič V, Lalovič D (1973) General model pseudopotential for positive ions. Phys Lett A 45: 59.
- Sweeney TR (1979) A Survey of Compounds from the Antiradiation Drug Development Program. Washington.
- Romantcev EF (1968) Radiation and chemical protection. Moscow.
- Handbook of Applicable Mathematics (1984) Vol.VI. Statistics. Part B. John Willey & Sons. Chichester-New York-Brisborne-Toronto-Singapore.
- Pustyl'nik EI (1978) Statistical methods for the analysis and processing of observations. Moscow.
- Förster E, Rönz B (1979) Methoden der Korrelations – und Regressionanalyse. Berlin.
- Fleiss JL (1981) Statistical Methods for Rates and Proportions. Chichester-New York-Brisborne-Toronto-Singapore.
- Urbach VY (1975) Statistical analysis in biological and medical studies. Moscow.
- Shannon C (1948) A mathematical theory of communication. Bell Techn J 27: 379.
- Mukhomorov VK (2012) Modeling of chemical compounds bioactivity. Relationships of structure - bioactivity. Lambert Academic Publisher, Germany.
- Yaschunsky VG (1975) Progress in the search for chemical protective agents against radiation. Russ Chem Rev 44: 260.
- Leo A, Hansch C, Elkins D (1971) Partition coefficients and their uses. Chem Rev 71: 525.
- Mukhomorov VK (2014) Bioactivity-structure. Interrelation of electronic and information factors of biologically activity of chemical compounds. Trends J Sci Res 1: 38.
- Mukhomorov VK (2011) Entropy approach to the study of biological activity of chemical compounds: The other side of radioprotectors. Adv Biol Chem 1: 1.
-
 Table 1
 -
Table 2
-
Table 3
-
Table 4
-
Table 5
-
Table 6
")